According to the three-year Action Plan (2018-2020) issued by The State Council. In recent years, with the rapid development of economy, environmental problems have become more and more prominent. Facing the increasingly prominent environmental problems, the government and enterprises need to invest a lot of manpower and material resources to govern. With the rapid development of the city, the construction dust, atmospheric dust, road dust, wheel mud, non-paved road wind erosion and water erosion, and other problems, seriously affect the effect of air pollution control.
In order to strengthen the scientific and fine management level of urban roads, improve the pollution control decision. Using vehicle monitoring data for special areas (such as controlled, provincial control air quality automatic monitoring sites and other key areas) is analyzed, find the main pollution sources around the sensitive area, provide data support for key areas targeted governance, promote multi-sectoral data connectivity and joint analysis, especially for road dust and dust problems in environmental protection, building, urban management, traffic and sanitation department data dynamic fusion. The organic combination of grid air quality monitoring, pollution source emission monitoring, atmospheric environment super station monitoring, pollution source list data, meteorological data, urban management data and muck truck data can realize the interconnection of environmental protection big data, and improve the scientific and intelligent level of urban air quality management on the whole.
Road dust
Road dust refers to the particulate matter formed by the dust on the road and street under the action of fixed dynamic conditions (wind force, motor vehicle tunnel pressure or crowd activity). Road dust is the main source of urban air particles, which has become a great public hazard in cities.
Dust accumulation load
Dust load refers to the dust mass passing through 200 mesh (75 μ m) standard sieve on the road surface per unit area, in g / m2. It is an important parameter affecting the emission coefficient of PM10 and PM2.5. The road dust load is not monitoring the roadside dust, but the dust monitoring of the road area.
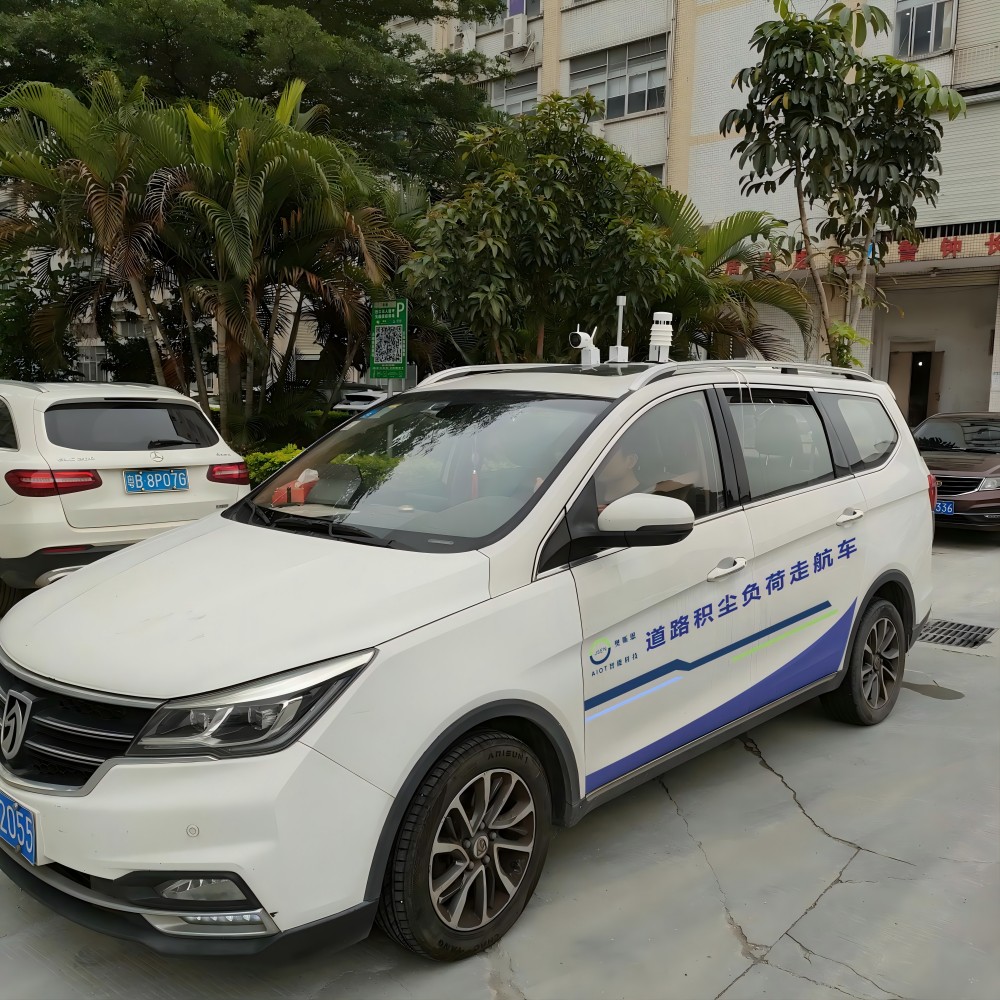
Road dust load vehicle mobile monitoring system
The system that raises the loose particles on the road surface, automatically monitors the road dust through the on-board sampling and monitoring device, and calculates the road dust load with relevant influence parameters, is referred to as the on-board mobile monitoring system.
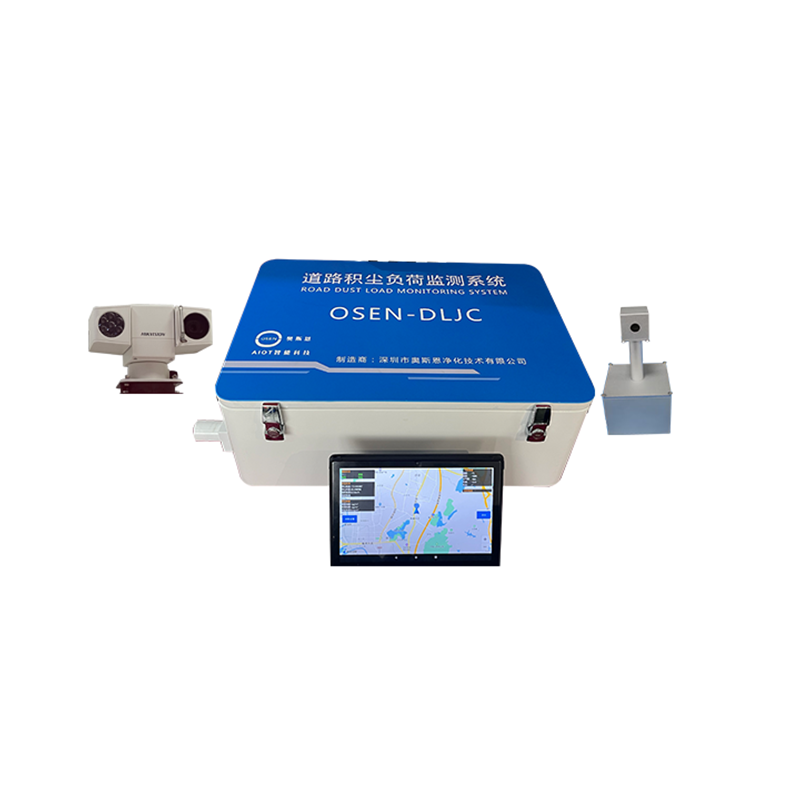
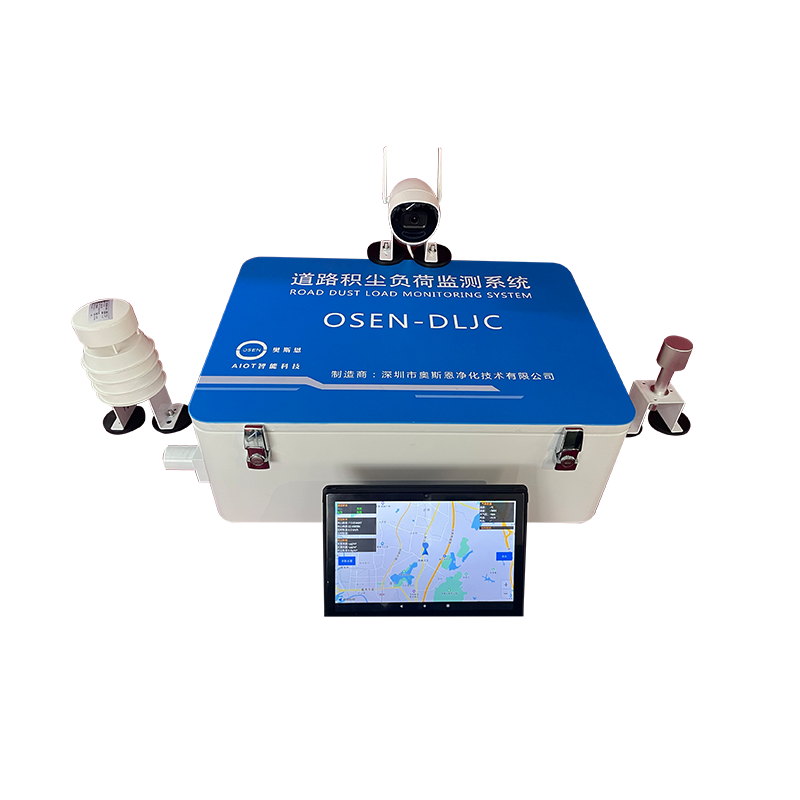
OSEN-DLJC road dust load fast navigation monitoring terminal is an online real-time monitoring of particulate matter in the atmosphere and dust raised by road vehicles. The collected data information will be transmitted to the intelligent cloud platform for processing, and customers will be given monitoring information, including the particle value and the points.
Product Parameter
|
The main technical indicators of the vehicle-mounted mobile monitoring equipment
|
|
order number
|
Measuring parameters
|
qualification
|
|
1
|
P M2.5
|
Using highly sensitive industrial-grade laser sensor
PM2.5 measurement principle: laser scattering
Measuring range: 0~1OOO ? g / m3(Detectable: 30 mg/m3)
Error: 100 ug / m ?, ± 10 ug / m ?; 100 ~ 1000 ug / m ?, ± 10%
Response time: 30s
|
|
2
|
P M10
|
Principle of PM10 measurement: laser scattering
Measuring range: 0~1OOO ? g / m3(Detectable up to 30 mg/m3)
Error: 100 ug / m ?; ± 15 ug / m ?; 100 ~ 1000 ug / m ?, ± 15%
Response time: 30s
|
|
3
|
T SP
|
Principles of TSP measurement: laser scattering
Measuring range: 0~1OOO ? g / m3(Detectable up to 30 mg/m3)
Error: 100 ug / m ?, ± 20 ug / m ?; 100 ug / m ?, ± 20%
Response time: 30s
|
|
4
|
Dust accumulation latent type
|
Measuring range: 0-20s
Response time: 30s
|
Performance characteristics
1) Set protection, measurement, signal, display and other functions in one;
2) With short circuit, overload, low voltage and other protection functions, various functions can be selected;
3) The use of advanced industrial chip, the bus chip, electrical isolation and electromagnetic shielding design in line with the relevant standards, so that the hardware system of the device has high anti-interference ability and work reliability;
4) The principle of detection, collection and analysis is mature and reliable, and can experience a long time of field operation test;
5) Real-time monitoring of dust at vehicle-mounted mobile point, and the monitoring site is not restricted;
6) No mounting bracket: applicable to various models;
7) The ester host adopts well-known brands;
8) When the detector samples, sample a value every 1s interval;
9) Can ensure that the ambient temperature should be between-10℃ and 40℃, the ambient relative humidity is less than or equal to 80%, and the ambient wind is lower than level 4, does not affect the normal use of the road dust detector;
10) Field test data can be exported through the platform export;
11) The tester is equipped with GPS, raw data export with GPS point point information;
12) The digital acquisition module controls the operation of the detection equipment and transmits the data to the computer system;
13) The working environment of the digital mining module: -10℃ to 50℃, the relative humidity of 5% -95%, no frost;
14) The sampling tube is used to transport the dust-containing airflow to the particulate matter monitoring unit, the pipeline length should be shortened, the inner diameter of the tube should be (50 ± 10) mm, the inner surface of the pipeline should be smooth, and the sampling tube should be smooth during the bend to avoid mutation;
15) Support remote monitoring, detection and early warning (optional);
16) The sampling port is used to collect the suspended particles raised by the driving force of the vehicle, and its design and material selection require smooth inner wall and anti-static;
17) Touch-screen LCD display, with a friendly interface;
18) The software can detect the control and management of the equipment and the real-time online data display;
19) The software can display the data of the detector, real-time speed and GPS information;
20) The current sampling data is automatically uploaded to the computer system after the end of each sampling;
21) The navigation map is displayed in standard map mode;
22) Tester will upload the data to the computer system, the system software automatically for data analysis, and according to the set concentration standard value of the corresponding color on the map, display the color section for the actual sampling sections, the concentration of dust load value corresponding color, to distinguish the different concentration gradient of dust load value;Enter the data interface, and you can view the historical data of the detected road.
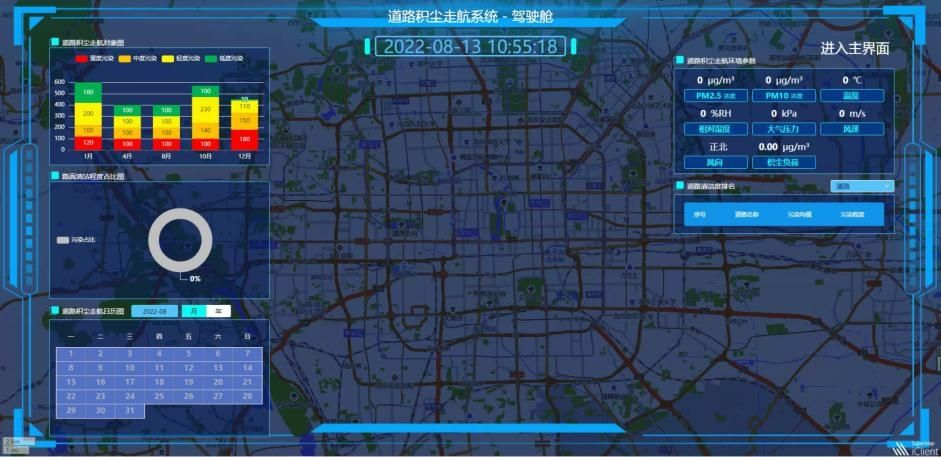
software function
1. Road air quality distribution
The city mobile air monitoring network provides road data query, display and dynamic computing tools based on geographic information platform, and provides users with a free mining and use data platform that can be flexibly adjusted according to their own business from three data dimensions, so as to improve the efficiency of users to explore a large amount of monitoring data.
2. Real-time thematic map of the air quality road network
Combined with geographic information, the massive second-level monitoring data uploaded by vehicles can be visually displayed, vividly showing the real-time change trend of air quality on the road and the pollution distribution. The system can switch the display content according to different display levels of the map, display the air quality data of urban trunk roads in large-scale areas, air quality monitoring results of street level roads can be displayed in mid-scale areas, and road air quality data of street level can be displayed at small-scale level.
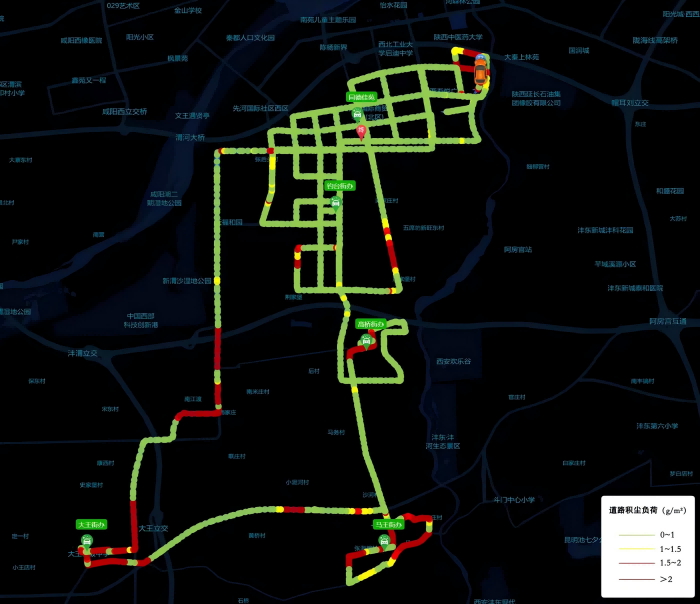
3. Road dust accumulation monitoring and display
Road dust monitoring display, through the road dust display based on the geographic information platform, vividly display the street dust pollution.
4. Road dust inventory ranking
Through the cumulative monitoring data over a period of time, the street cleanliness of the city is ranked, and the pollution degree based on road attributes is analyzed.
5. Real-time data for vehicles
Can be determined according to different pollution parameters (TSP, PM10, PM2.5) Display the real-time location and monitoring concentration of each vehicle, and you can also view the real-time temperature and humidity information.
6. Overstandard monitoring
The road sections exceeding the standard were extracted and displayed, and the roads with different pollution levels were displayed independently.