System summary
Sound environment automatic monitoring data statistical analysis platform is by our company ten years noise application management experience, meet the demand of users comprehensive noise business management application software, in line with the national sound environment quality automatic monitoring standard (HJ 906 and HJ 907) requirements, is widely used in the national professional noise automatic monitoring management system.
This system can realize the noise pollution source monitoring real-time emission level monitoring at the same time, can automatically warning excessive noise emission behavior, through the intelligent analysis of noise source characteristics, automatic linkage camera capture forensics, form excessive event alarm information, remind on the spot the noise subject to rectification, and notify the law enforcement, supervision department to supervise the implementation. Through computer and mobile terminal, video monitoring, excessive recording, excessive alarm, historical inquiry, on-site law enforcement and other functions, with on-site alarm, alarm push and other alarm notification, which provides a strong basis for noise data network management and real-time data analysis.
The large screen of acoustic environment displays the real-time status, monitoring data and noise pollution diffusion map of all front-end equipment, which facilitates the management department to better implement the overall monitoring, early warning and coordination and scheduling of pollution emission, control excessive emissions in time, and avoid the expansion of environmental pollution. Through the platform, the distribution of noise monitoring points can be viewed in real time, noise problems can be located, and fault diagnosis and noise control can be conducted through data analysis.
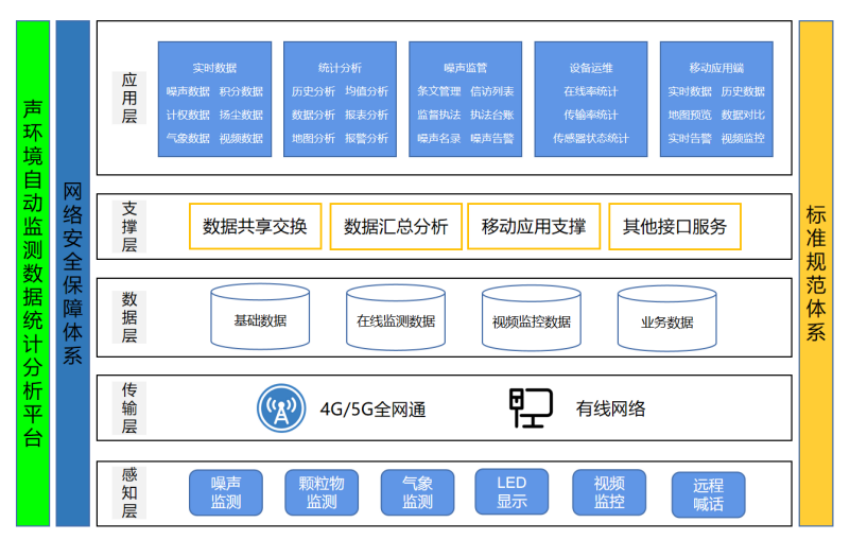
Platform architecture
Platform function configuration
Our company assigns different system permission functions for customers according to the level of users, as shown in the following table.
|
System module
|
List of functions
|
Functional permissions
|
domestic consumer
|
Star users
|
|
system management
|
Log management
|
|
√
|
|
user management
|
|
√
|
|
Role management
|
|
√
|
|
device management
|
√
|
√
|
|
Equipment added
|
|
√
|
|
data model
|
|
√
|
|
The alarm rules
|
|
√
|
|
Information supplement
|
|
√
|
|
Noise monitoring
|
Equipment monitoring
|
area data
|
√
|
√
|
|
Site details
|
√
|
√
|
|
Map monitoring
|
√
|
√
|
|
Video surveillance
|
√
|
√
|
|
General view of the state
|
√
|
√
|
|
Electronic fence
|
|
√
|
|
Sound environment quality analysis
|
A 24-hour trend analysis
|
|
√
|
|
Long-term mean
|
|
√
|
|
Distribution trend
|
|
√
|
|
Site comparison
|
|
√
|
|
Noise map
|
|
√
|
|
data acquisition
|
query and pivot
|
√
|
√
|
|
historical data
|
√
|
√
|
|
Data report
|
|
√
|
|
condition monitoring
|
|
√
|
|
Data audit
|
|
√
|
|
live recording
|
|
√
|
|
Collect images
|
|
√
|
|
frequency analysis
|
√
|
√
|
|
Noise regulation
|
Noise alarm
|
√
|
√
|
|
|
Historical alarm
|
√
|
√
|
|
Sound environment large screen
|
|
√
|
|
Custom login interface
|
|
√
|
|
application management
|
android APP
|
√
|
√
|
|
Wechat small program
|
√
|
√
|
|
Wechat public account
|
√
|
√
|
device attachment
The platform meets the functional requirements of the National Sound Environment Quality Automatic Monitoring Standard (HJ 906 and HJ 907), integrates general equipment communication protocol, the underlying protocol is TCP / IP protocol, the application layer protocol is HJ 212-2005, HJ 212-2017, MQTT, etc. Each protocol uses load balancing technology to achieve multiple disaster recovery.
Platform support a variety of monitoring instruments (noise monitoring station, conventional air station, miniature air station, dust online monitoring station, laser radar data, online source analysis data, super station data, online lampblack monitoring data, etc.) data access at the same time, realize the monitoring data with screen display and view, for accurate analysis of air quality, provide a comprehensive data support.
Functional detailed explanation
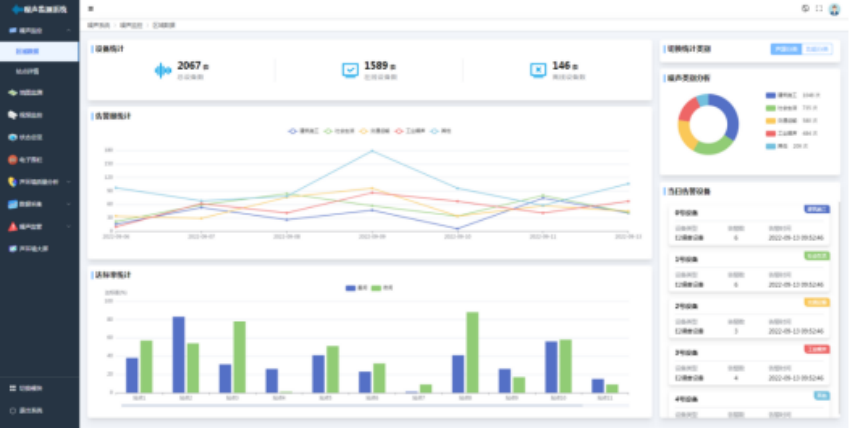
Noise monitoring-Area data
To review the status of the current user?s device, the statistical mode is divided into two types, classified by sound source and classified by function. At a glance, we can know the total number (the total number of devices, online status, offline status), the alarm statistics under different categories, the standard rate of day and night data of different sites, the data classification of alarm noise, and the record of the alarm (including equipment type, alarm times and alarm time).
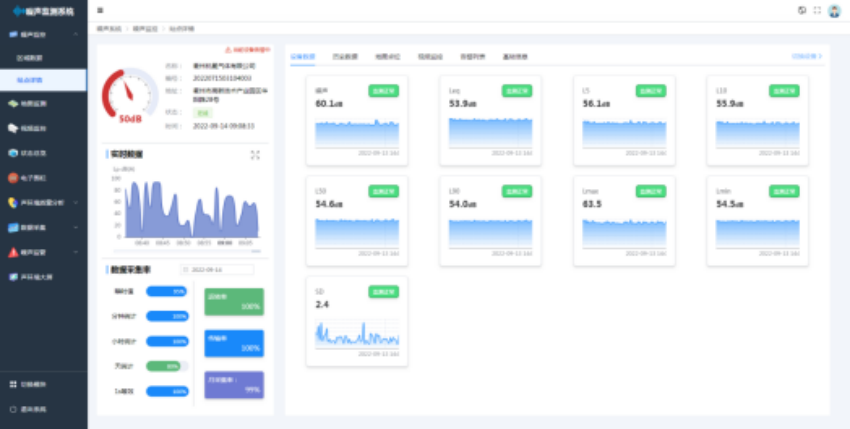
Noise monitoring-Site details
Site details are the main functional interface to display the site map location, basic information, historical data, video monitoring, current alarm list, real-time meteorological data, real-time instantaneous sound level data, data acquisition rate, etc. When there are multiple devices under the account, the equipment status of display at each point can be displayed through the icon (offline, online, alarm, partition), and click the map icon to select the device; or through operation: select the equipment for quick selection of other devices.
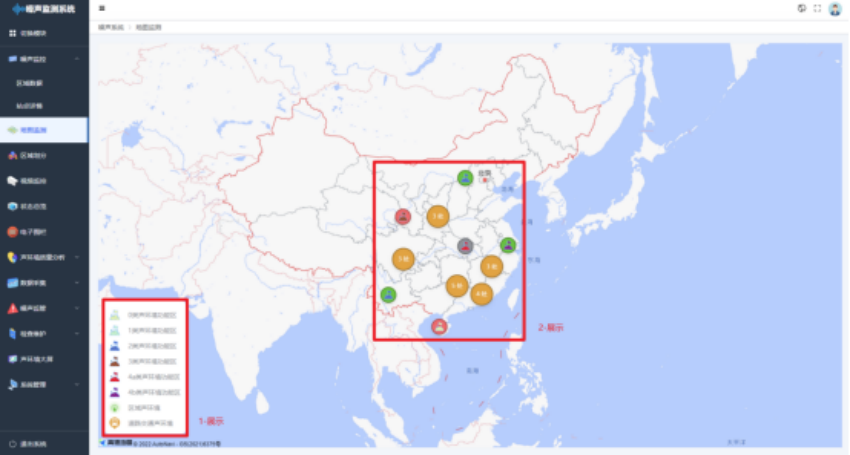
Map monitoring
Aggregate points show the number of aggregated devices, call Amap to display the installation points of devices, identify different equipment types with different devices, click again to display real-time data, and click the details page to enter the main interface of the device.
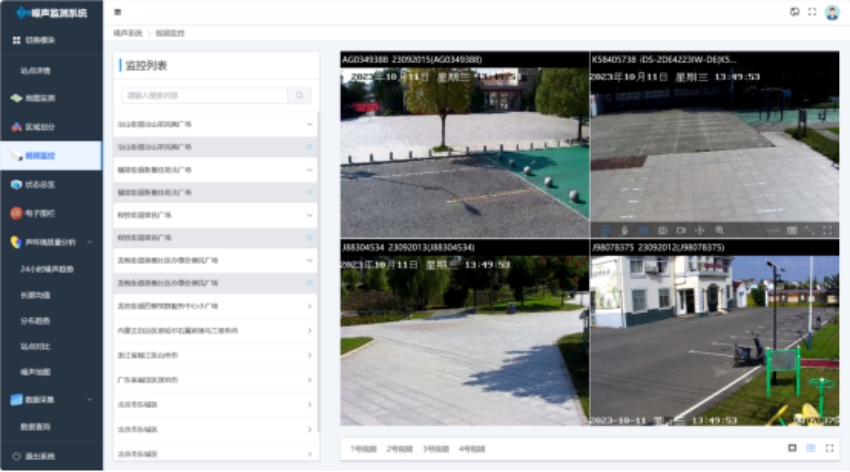
Video surveillance
The monitoring preview of the equipment can realize the ball machine cloud head control, video playback, remote propaganda and other functions.
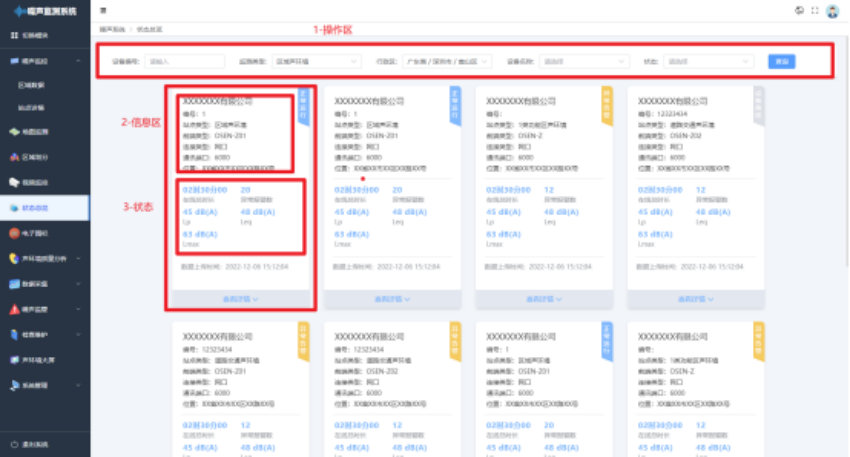
General view of the state
Status overview can view the running status and device information of all devices under the account. You can quickly search through the device number, monitoring type, administrative region, device name and status type. Click to view the details to jump to the device details page.
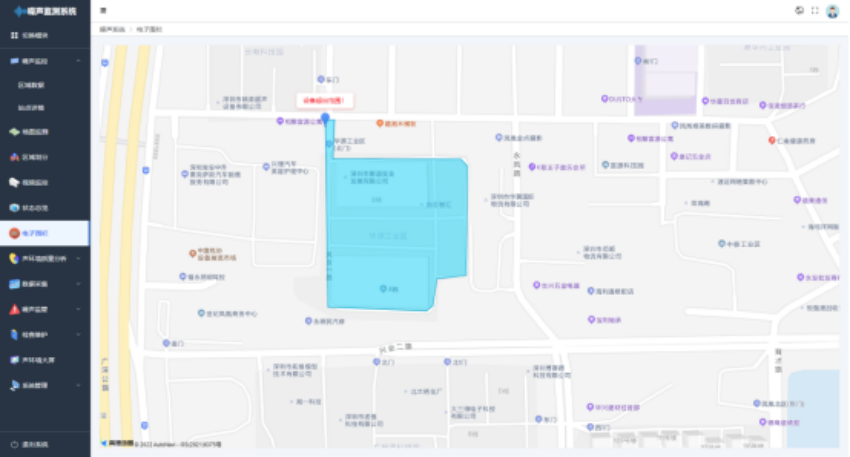
Electronic fence
The electronic fence area can be delimited. When the equipment positioning exceeds the set area, the alarm function can be realized, and the alarm information can be pushed to the relevant responsible person.
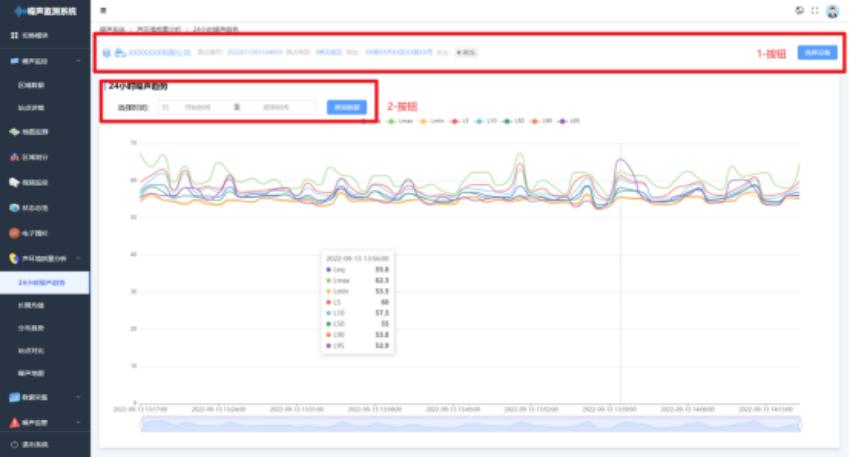
Acoustic environment quality analysis- -24-hour noise trend
Draw the sound level changes for 24 hours. When drawing the overall time distribution map, the hourly equivalent sound level of the same point and different dates adopts energy average, and the hourly equivalent sound level of different points in the same functional area adopts arithmetic average.
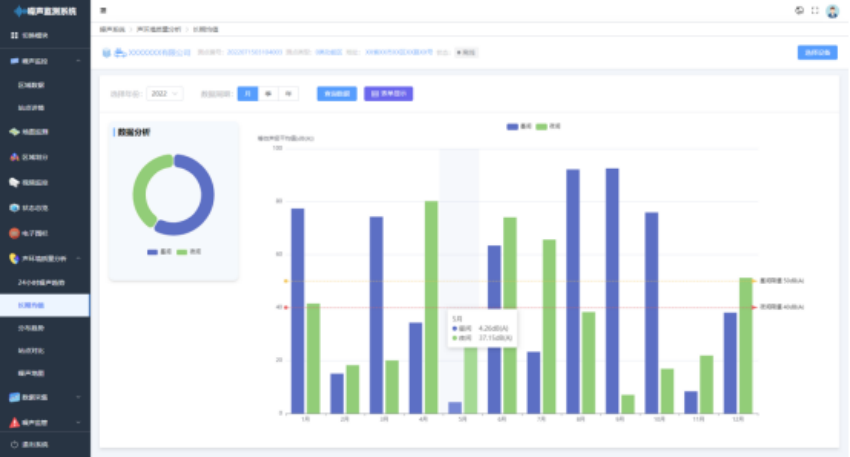
Sound environment quality analysis-long-term mean
The average energy of day and night equivalent sound levels per month, season and year of each monitoring point was calculated, and analyzed and evaluated according to the corresponding environmental noise limits in the Standard for Environmental Noise in Urban Areas GB-3096.
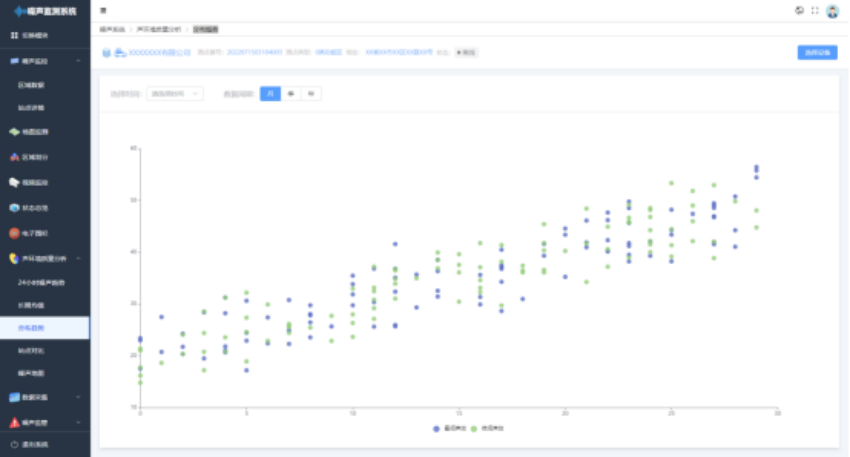
Sound environment quality analysis-distribution trend
The distribution of daytime and night equivalent sound levels at each monthly, quarterly and annual monitoring point was counted, and the normal noise level and noise level in emergencies were analyzed.
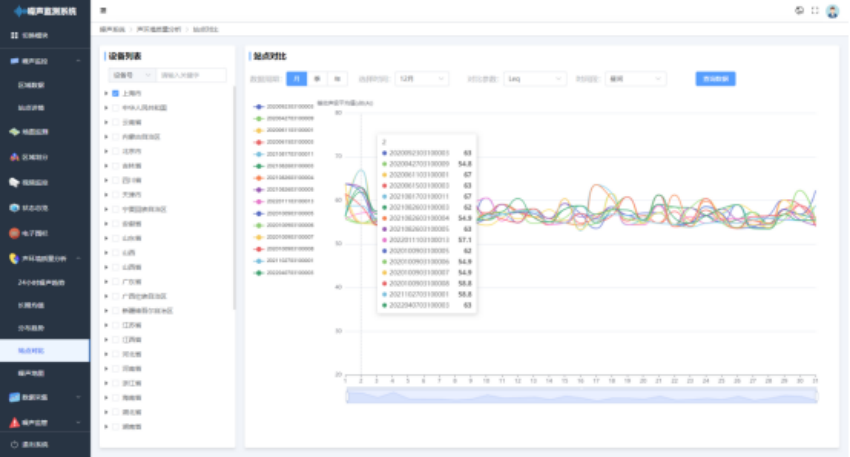
Sound environment quality analysis-site comparison
The characteristics of various functional areas are analyzed from the aspects of average equivalent sound level between day and night, 24-hour change trend, change trend of 12 months and the situation of exceeding the standard.
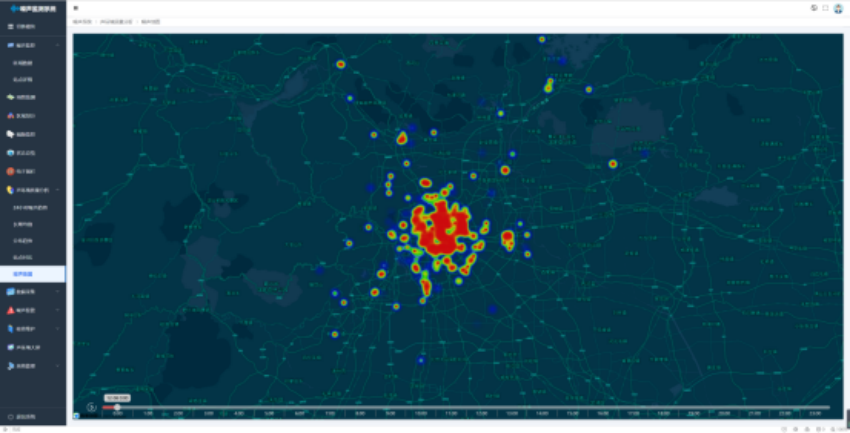
Acoustic environment quality analysis- -noise map
The visual display of noise data map, can use the time axis to be used to play and play back the data to realize noise traceability.
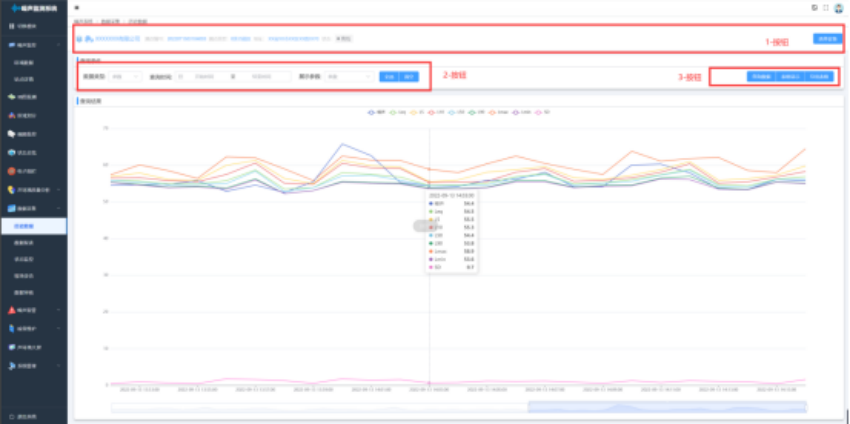
Data acquisition- -Historical data
The display of historical data of each site can be displayed by means of charts and data tables, supporting the selection of data type, query time and display parameters, graphical display / table display switch, and the export of tables to local.
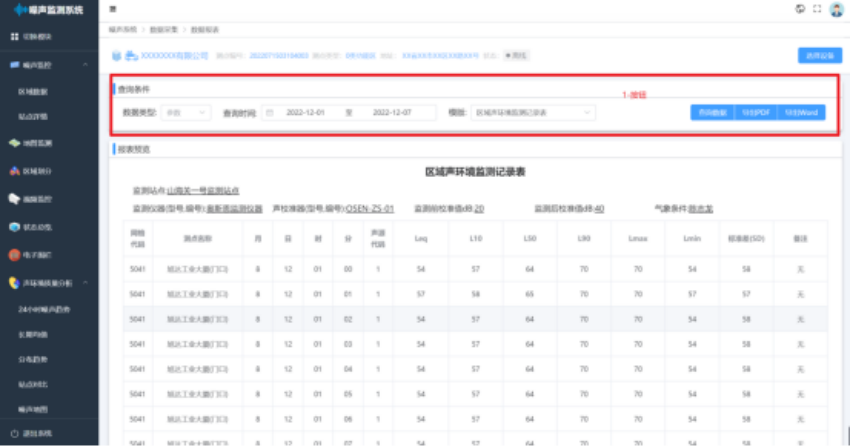
Data Acquisition-Data Report
Support users to customize the statistical cycle and report report template, data report report support table and graphics, can be exported to the local save.
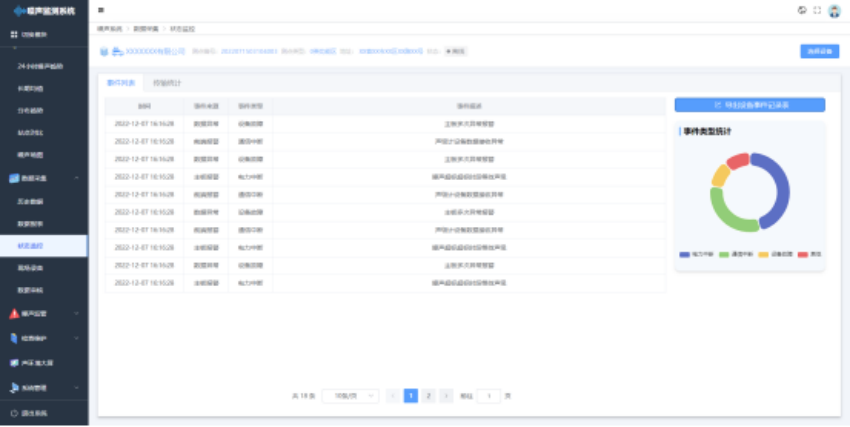
Data acquisition-Status monitoring
Statistical equipment status events (power interruption, communication interruption, equipment failure, etc.), support to generate fault statistical report,
Including device data upload, transmission situation statistics, support the export of device event record table.
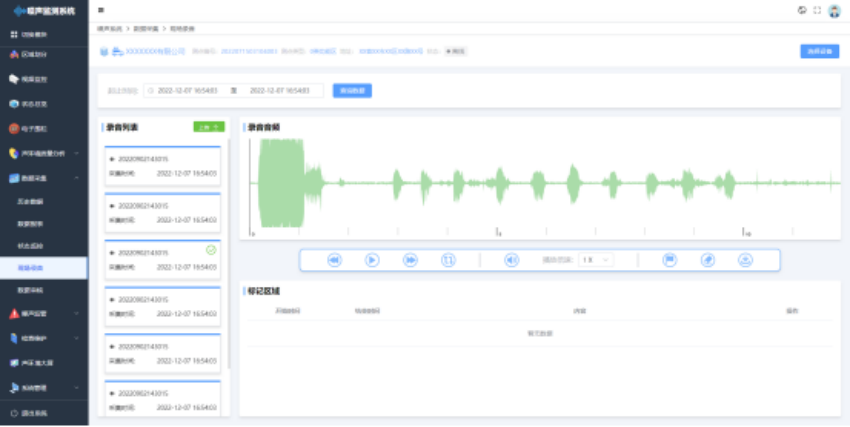
Data acquisition- -live audio recording
You can select the device noise recording file, and support playback (support fast forward, pause, replay, multiple setting and other functions), mark recording events, and upload recording functions.
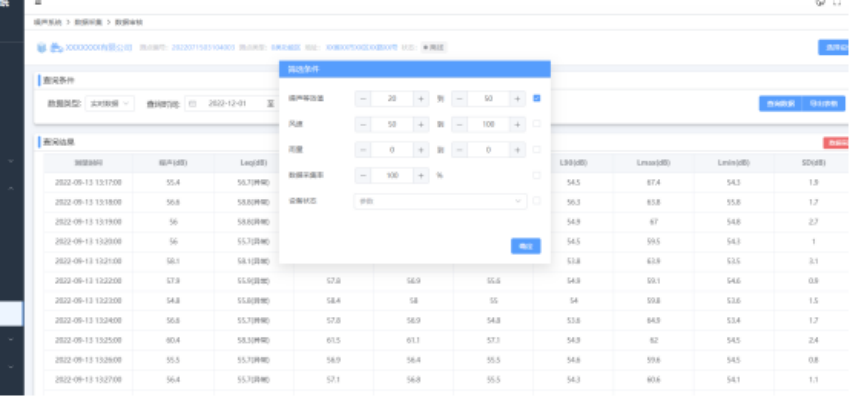
Data acquisition-Data review
The abnormal value judgment conditions can be set for the noise monitoring data of each period (data that do not meet the data collection rate, data that do not meet the relevant standard meteorological conditions, random value generated by the failure of sub-station monitoring equipment, etc.) to mark and prompt the abnormal data, and support the manual review of the data.
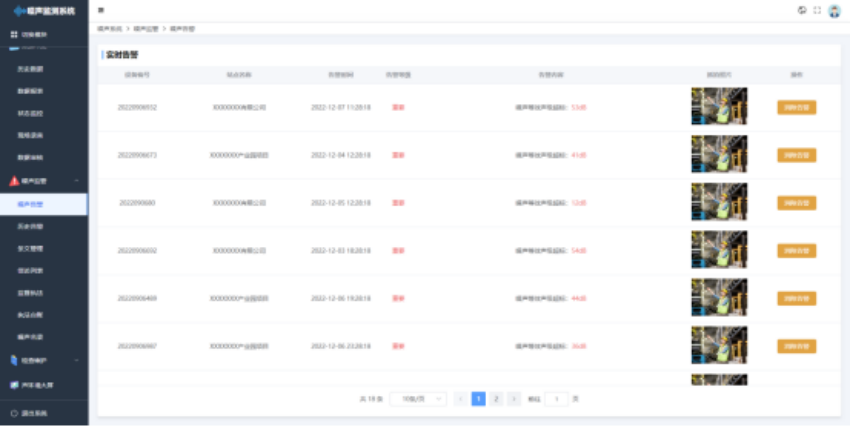
Noise supervision-Noise alarm
When the noise equipment exceeds the set standard, conduct the alarm, capture the field camera, upload the photos to the supervision platform, and push the alarm information to the relevant responsible person.
Noise supervision-a historical alarm
Search the historical alarm record of the equipment, which can be retrieved according to the time range and alarm type.
System Management-Log management
The system operation records of all users can be queried to avoid violations
System Management-User management
It can add, delete and change users, and allocate equipment to users for easy management
System Management-Role management
The role can be customized, defined according to the free role of the user enterprise, and assigned the corresponding functional rights
System Management-Equipment management
You can query all the equipment under your name, and you can add, delete and change the equipment
System Management-Equipment is added
This function can access a new device, and here, fill in the corresponding device information corresponding to the access device
System management-Equipment templates
Build the equipment template according to the information of the access equipment
System Management- -Alarm Rules
Set the alarm rules of the equipment according to the user requirements, and the platform can be conducted after triggering the alarm, and the public account can push the alarm
System Management-Information Supplement
Further supplement the equipment information, and you can draw the electronic fence area according to the installation position of the equipment.
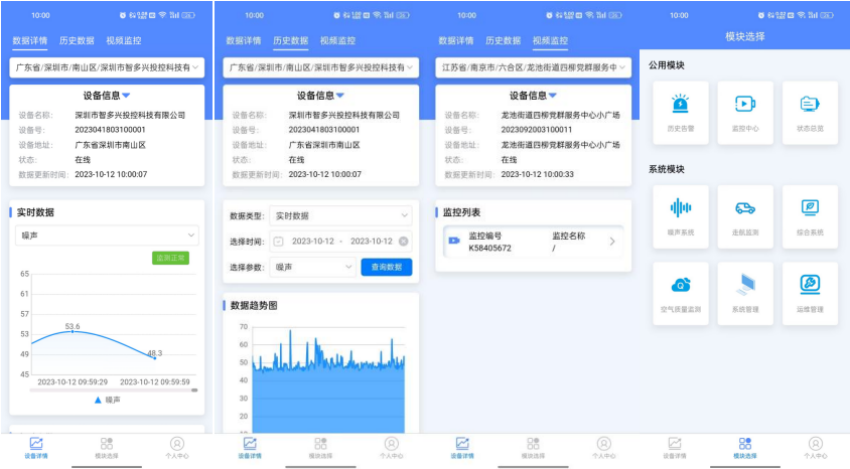
mobile terminal
Intelligent cloud data analysis software APP, based on online environmental monitoring system, show customers real-time monitoring data, and the recent 48 hours of historical data, the recent 30 days average historical data, equipment online status and push overweight alarm information, comprehensive analysis of management data, can realize remote view understand the environmental pollution of the equipment area. Provide users with accurate, stable and guaranteed reference information, timely and effectively diagnose the air pollution situation within the jurisdiction.
Real-time data: Intelligent cloud real-time display of the pollution value of the current atmospheric monitoring indicators and the online status of the equipment. The data update cycle is 3 minutes. Intelligent cloud is a professional data analysis software for data receiving, saving, display, analysis and management.
Historical data: Through the curve analysis chart of historical data, you can intuitively and quickly read the changing trend of the historical data and the daily average data of the last 30 days.
Equipment management: it can check whether the device is online, the user unit information and geographic information.
Humanization: instead of SMS alarm reminder function; equipment alarm can timely notify mobile phone users like SMS, timely warning, avoid tickets. WeChat terminal can receive feedback to the osnn public number manager.